Discover
Interviews, a look at how the work really happens, and a short prototype of the riskiest idea. You get scope, budget and a roadmap in writing.
1–3 weeksDashboards and data pipelines that answer the questions you actually ask.
How we work
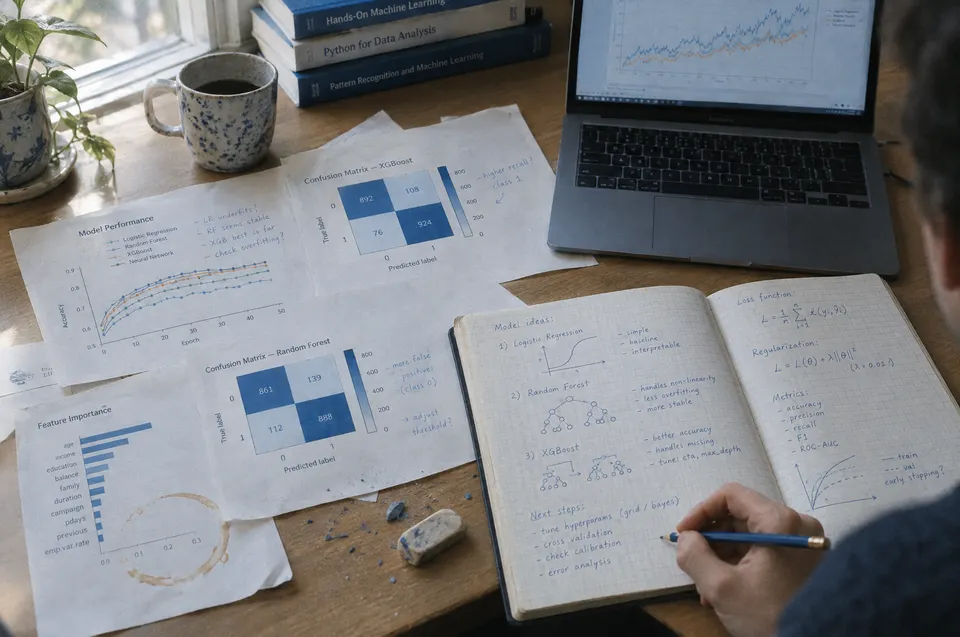
Most businesses already have the data to make better decisions — it is just scattered across systems and spreadsheets. We bring it together, clean it up and turn it into dashboards people trust.
We start with your questions: Which customers are most profitable? Where do orders stall? What will next month look like? Those questions decide which data we collect and how we model it.
We then build pipelines that pull data from your operational systems into a central warehouse on a schedule, with tests that flag missing or suspicious numbers before they reach a dashboard.
Finally we design dashboards and automated reports for each audience — leadership, operations, finance — with definitions everyone agrees on, so meetings are about decisions instead of whose number is right.
Every engagement is scoped to your needs. These are the pieces we deliver most often.
Interviews, a look at how the work really happens, and a short prototype of the riskiest idea. You get scope, budget and a roadmap in writing.
1–3 weeksPaper sketches, wireframes and clickable prototypes tested with real users, then a visual design system developers can build from.
2–4 weeksTwo-week sprints with a working demo at the end of each one. You see progress in the software, not in a slide deck.
6–14 weeksA careful release, training for your team, monitoring from day one — then a support plan that keeps the software improving.
OngoingYes. Many projects begin by automating the spreadsheets you already maintain, then moving them onto a proper data foundation.
It depends on your team and budget. Looker Studio and Metabase are excellent, low-cost starting points; we also work with Power BI and Tableau.
Most dashboards refresh hourly or daily. Where it matters, we build near real-time pipelines.
A free 30-minute call is the easiest way to start. Bring the problem, the half-formed idea or the spreadsheet that runs your business — we’ll bring questions.
Book a discovery call or call (773) 848-8874